How is the reach of out-of-home advertising measured?


How many people actually see your City Light Panel? That’s the question we get asked most often. The short answer: In the Netherlands, the reach of outdoor advertising is officially measured by NMO Buitenreclame. This is done using traffic counts, a panel of thousands of people using an app, a database of over 60,000 advertising spaces, and eye-tracking research. Below, you can read how this works, and which misconception costs advertisers the most money.
Reach is not the same as contacts
We see the biggest misconception in almost every conversation: reach is confused with contacts. And contacts are also counted in different ways. One person counts based on passersby, another on ROTS, and a third on VAC. Analog and digital counting methods differ as well. For those who focus closely on CPM, the cost per thousand contacts, that makes a world of difference.
- Reach is the number of unique people who have seen your ad at least once.
- contacts This is the total number of times your post has been viewed. So, one person can make multiple contacts .
- Contact frequency is the average number of times someone sees your ad: the contacts divided by the reach.
From Passersby to Leads in Three Steps
We always explain it in three steps. Each step involves a more rigorous selection process than the previous one.
1. Passersby: Who’s coming by?
First, we look at how many people actually come near the site: on foot, by bike, by car, or by public transportation. That’s the largest and most diverse group. No one has seen anything here yet.
2. ROTS: Who can see it?
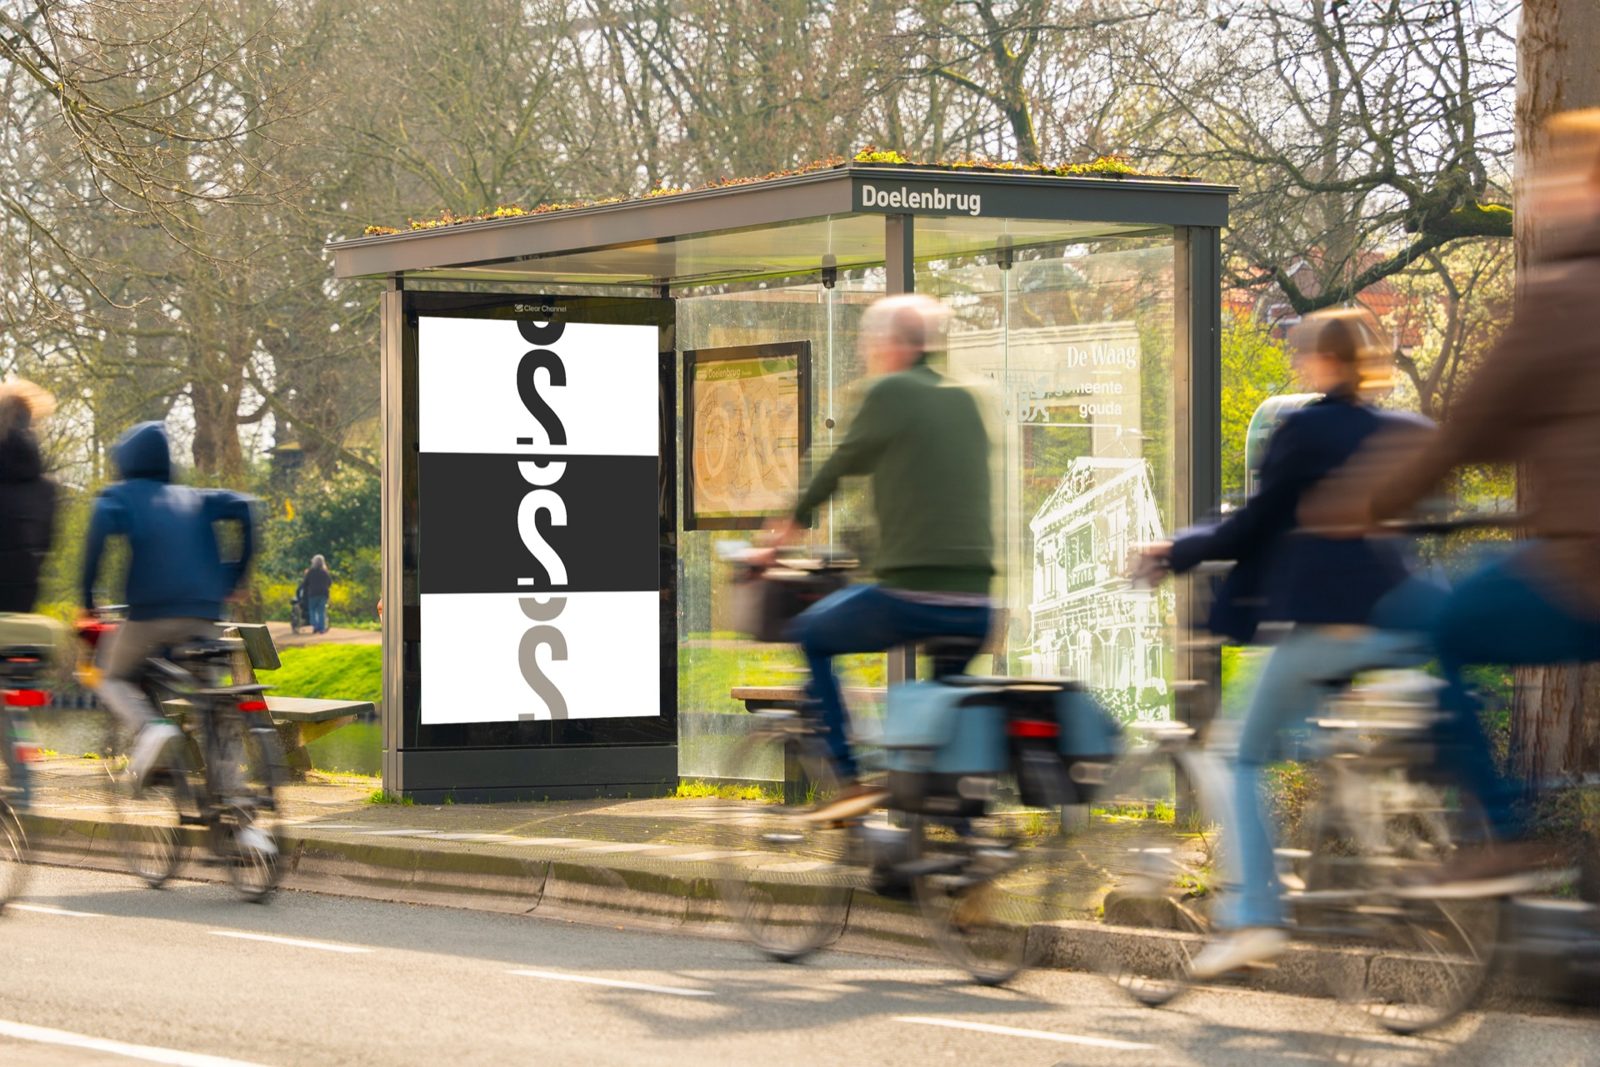
Next, the walking paths are determined. Who moves in such a way that the poster really comes into view? This is called “ ROTS ”: realistic opportunity to see. Here’s an example. If there’s a poster on the front of a City Light Panel and one on the back, someone walking straight toward the back counts as a passerby. But for the poster on the front, that person isn’t a “ ROTS.” Buildings, trees, and other obstacles in the line of sight are also taken into account.
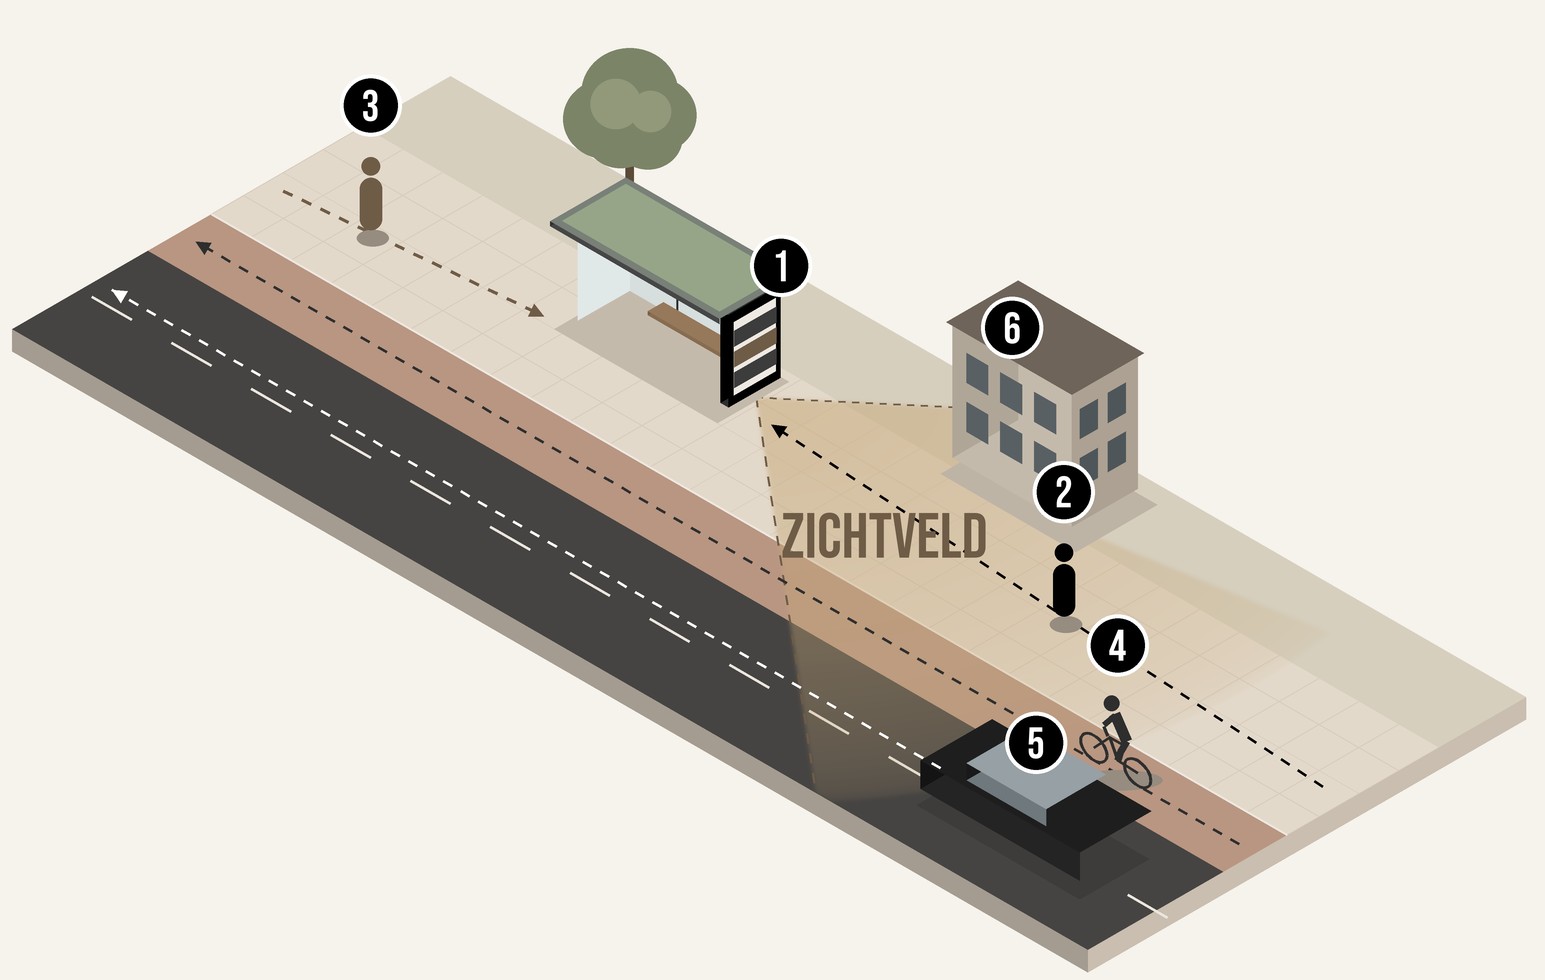
- Poster. The light area in front of it is the field of view.
- Appears toward the end of the poster. Counts as ROTS. The longer it's on screen, the greater the chance of VAC.
- He's coming from the other side. He sees the back of the City Light Panel: just a passerby, not a " ROTS."
- Cyclist. Passes by faster, so remains in view for a shorter time.
- Car. Only briefly in view, so the driver is less likely to really look.
- Building. Blocks part of the view. Anyone walking behind it doesn't count.
3. VAC: Who’s really watching?
Every advertising space has a field of view: a cone in front of the poster from which you can see the ad, the cone of view. The longer someone moves through that field of view, the greater the chance that they’ll actually look at it. So, someone walking calmly toward a City Light Panel is more likely to look at the ad than someone driving past at 50 kilometers per hour. This probability has been established through years of eye-tracking research and is called “ VAC: visually adjusted contact.” A “ VAC ” is the highest-quality contact there is.
Analog and digital counting work differently
With an analog City Light Panel, your poster remains on display for the entire campaign. We report on this at VAC. With a digital screen, you share the screen with other advertisers, and your ad is displayed only part of the time. Only the time your ad is on screen counts. We report on this at ROTS, because VAC is not calculated for digital screens.

So never just compare the CPM of a digital campaign with that of an analog one. You’re comparing two different things.
“A million people will pass by this tower”
We hear that phrase a lot. It’s probably true, too. But just driving by doesn’t count as looking. And you’re not visible on a digital billboard all the time. Many advertisers use their own foot traffic figures, and unfortunately, those figures are often interpreted quite loosely.
A sample calculation using fictitious numbers illustrates how the denominator affects the price. Suppose you spend €10,000:
- Divided by 2,000,000 passersby, the CPM is €5.00.
- Divided by 800,000 ROTS the CPM is €12.50.
- Divided by 300,000 VAC the CPM is €33.33.
The same campaign, three very different prices. The cheapest one is the least transparent. That’s why we always use the official figures, and we specify which denominator we use for each figure. To learn how prices for outdoor advertising are determined, read “How Much Does Outdoor Advertising Cost?”
How the research works: four building blocks
Since April 2024, the Netherlands has been measuring the reach of out-of-home advertising in a new way. The study began as BRO Next and is now called NMO Buitenreclame. It combines four sources:
- Traffic volumes. The number of people passing through each road segment, by mode of transportation, compiled from more than thirty sources.
- A mobility dashboard. At least 7,000 people per month use an app that tracks their outdoor movements. This provides information about who is visiting: age, gender, and education level.
- An object database. Over 60,000 advertising spaces, each with its exact location, dimensions, height, angle relative to the road, and lighting.
- Visibility. Eye-tracking research that determines how likely it is that someone is actually looking.
The previous study was based on a one-time GPS measurement of approximately 2,500 people conducted in 2008 and 2009. Now, measurements are taken on an ongoing basis. As a result, the old and new coverage figures cannot be compared.
Important for the future: This study is part of the National Media Survey, just like the measurements for TV, radio, print, and online. Over time, this will make it possible to compare the reach of all media side by side. Then you’ll see what your outdoor campaign adds to your TV campaign.
What This Means for Your Campaign
For us, the biggest change was in what we can show. In the planning tool IDS, we no longer just run the numbers for a single week. We build a campaign in layers: these formats in week one, different ones in week two, and then the reach and frequency across the entire campaign. By target audience, by location, and for digital, even by the hour. This way, you can see in advance what each layer contributes.

We prefer to design campaigns with multiple touchpoints across different formats, such as City Light Panels in the city combined with digital billboards along the road. Research shows that the impact increases with more formats, because people then encounter your brand through multiple touchpoints. Reach figures are the guiding factor in every decision.
A question we're curious about

Take the giant screen at Hoog Catharijne in Utrecht. In the study, that size translates only to “ contacts ”: a larger screen has a wider field of view, so more people can see it. But what effect does such a giant screen have on our brains? If an object is that large, you’d expect the emotional impact to be much greater as well. That’s not reflected in any reach figures yet. We’re very curious to see research that does measure that.
What about the effect? Here's how to measure your impact
The reach of outdoor advertising is easy to measure. Direct conversion is more difficult to track, because no one clicks on a City Light Panel ad. If you want to know what a campaign delivers, work with a test region. Here’s an example: run outdoor advertising exclusively in Alkmaar. Expand the radius a bit, since people from Heerhugowaard and Bergen also come to Alkmaar. Then compare website traffic from that region with a similar region where no campaign is running. Also read about how to gain visibility in a single city or opt for regional coverage.
When it comes to digital, we're part of the process ourselves
A projected reach figure is an estimate. With digital campaigns, we also want to see what actually happens. That’s why we track delivery ourselves, whenever the network allows it: by embedding our own tracking pixel in the ad, every time it appears on a screen is recorded.
All of these metrics are consolidated at SIRIUS, our proprietary client portal. There, you can see in real time how many impressions and contacts your campaign has generated so far, by day and even by hour, and whether it’s on track. No post-campaign reports, just real-time monitoring while the campaign is running.
Here's How We Work with Reach Metrics
- Always use the official measurements. We use the NMO Buitenreclame figures in IDS, never individual pedestrian traffic counts.
- The denominator is listed. For analog, see VAC; for digital, see ROTS. You always know what you're comparing.
- A quality check for each City Light Panel. Using “Pick or Skip,” we rule out areas that yield little benefit and prioritize the strongest side of the street.
- We track digital metrics. At SIRIUS, you can see in real time what has actually been delivered.
- Layered campaigns. With reach and frequency by layer, so that every euro makes a difference.
Wondering how many people your campaign is actually reaching? Schedule a free strategy session.
Frequently Asked Questions
What is the difference between ROTS and VAC?
ROTS "Realistic opportunity to see" counts everyone who can actually see an ad: within the field of view and facing the right direction. " VAC " goes a step further and counts only the probability that someone is actually looking at it. " VAC " is therefore always lower than " ROTS," and represents the highest-quality contact.
Who measures the reach of out-of-home advertising in the Netherlands?
NMO Buitenreclame, part of Nationaal Media Onderzoek, is responsible for this. The study began in April 2024 under the name BRO Next. Media agencies and advertisers use the planning tool IDS to calculate the figures.
Why doesn't a digital screen have a " VAC"?
A digital screen is shared by multiple advertisers, and your ad appears on it only part of the time. For digital screens, therefore, ROTS is used to calculate the time your ad is on screen. A VAC is not calculated for digital screens.
Can you compare old and new reach figures?
No. The study conducted prior to April 2024 used different data, a different method, and a different population group. Therefore, the figures from the earlier study cannot be compared with the current figures.